
HOME › CASE STUDIES
Projects · Performance · ContextCase studies
Projects and the numbers behind them. Every snapshot is shared with its reporting context, so you can see what the dashboard shows—and what it doesn’t.
Explore the snapshots ↓Featured case studies
Dashboard snapshots, made easier to understand.
Review the store metrics shown in the supplied screenshots, then open each case for its visible figures and context.
Read the numbers with context. These screenshots are dashboard snapshots, not controlled before-and-after studies. Results can be affected by traffic quality, product pricing, seasonality, ad spend, inventory, and other factors.
Inside the snapshots
What each dashboard view shows.
The key figures below are transcribed from the uploaded images. Reporting views can differ by date range and account context.
01 / 04 · SUPPLIED DASHBOARD90-day dashboard view
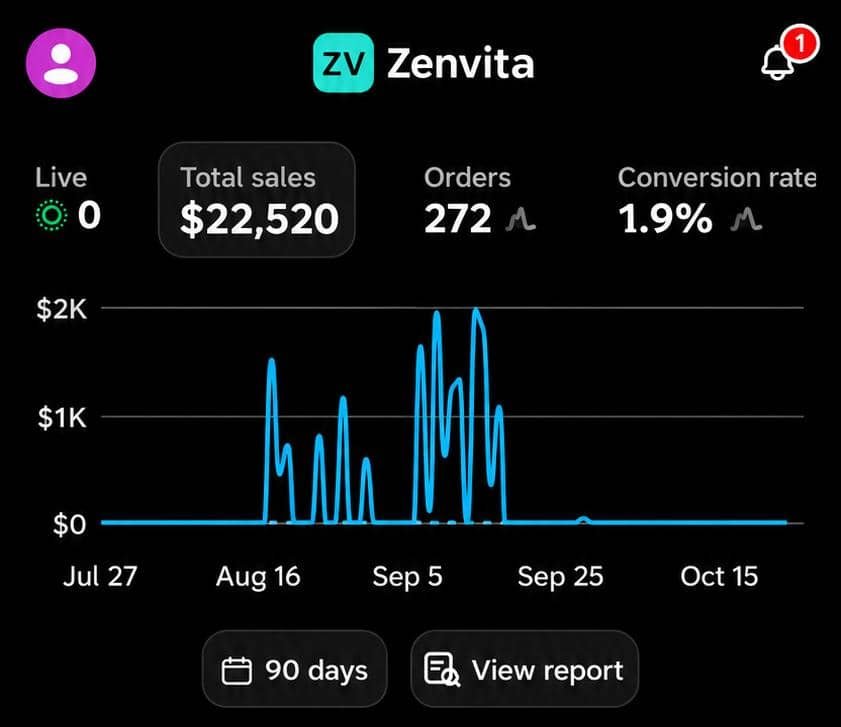
ZenVita: reading the dashboard snapshot.
The screenshot shows $22,520 in total sales, 272 orders, and a 1.9% conversion rate for the selected dashboard view. These figures are shown as reported in the supplied image; they are not presented as a controlled before-and-after result.
Total sales$22,520
Orders272
Conversion rate1.9%
Figures are transcribed from the supplied screenshot. They are not a guarantee of future performance or proof that a particular change caused the outcome.
Discuss a project like this02 / 04 · SUPPLIED DASHBOARD90-day dashboard view
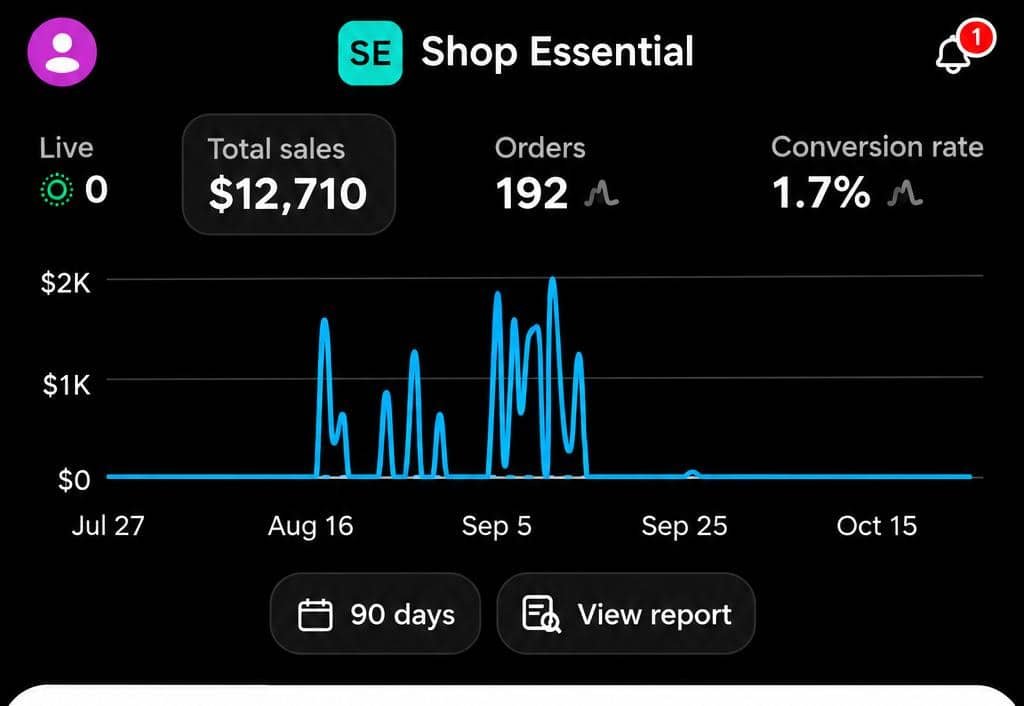
Shop Essential: reading the dashboard snapshot.
The supplied dashboard image displays $12,710 in total sales, 192 orders, and a 1.7% conversion rate. The screenshot is a point-in-time view; interpretation depends on traffic, offers, seasonality, and the store’s wider operating context.
Total sales$12,710
Orders192
Conversion rate1.7%
Figures are transcribed from the supplied screenshot. They are not a guarantee of future performance or proof that a particular change caused the outcome.
Discuss a project like this03 / 04 · SUPPLIED DASHBOARD90-day dashboard view
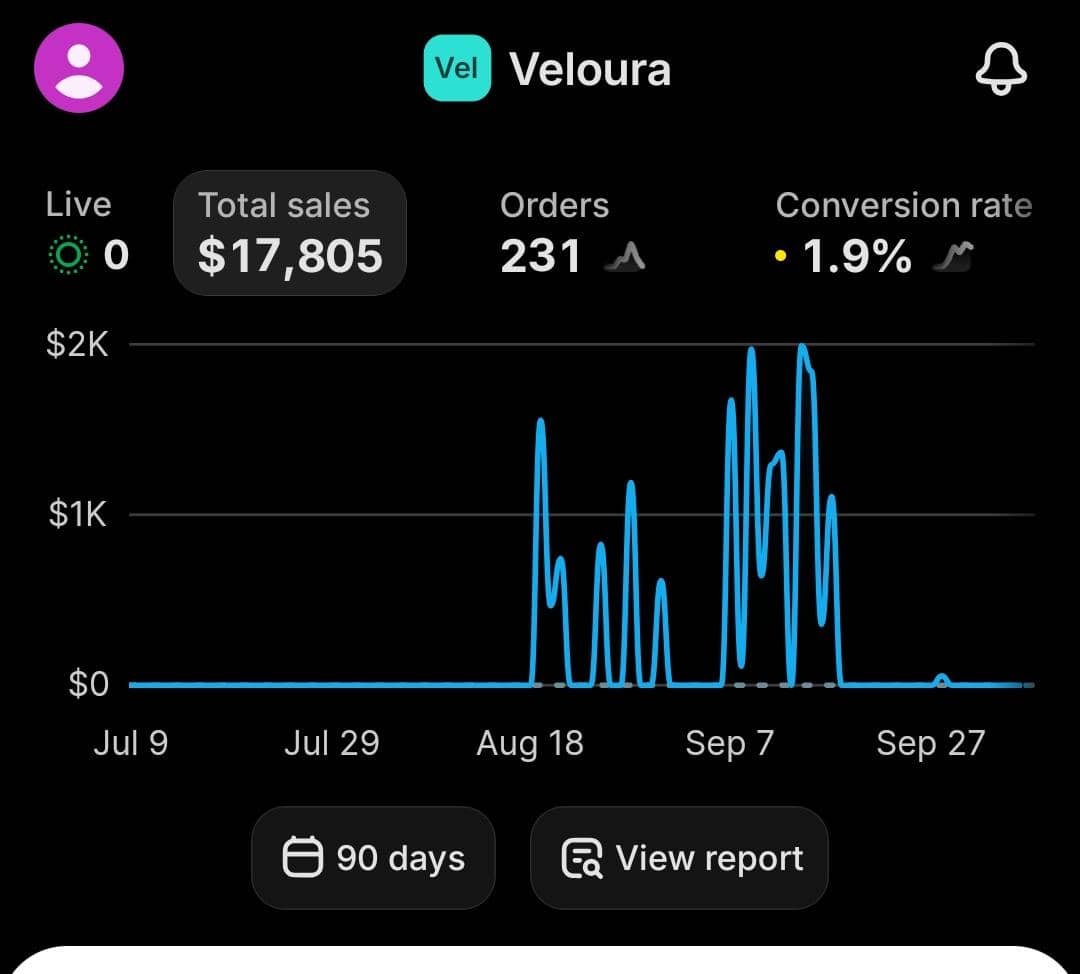
Veloura: reading the dashboard snapshot.
The submitted Veloura screenshot shows $17,805 in total sales, 231 orders, and a 1.9% conversion rate. These are figures visible in the supplied dashboard image, rather than a claim that a single service caused this performance.
Total sales$17,805
Orders231
Conversion rate1.9%
Figures are transcribed from the supplied screenshot. They are not a guarantee of future performance or proof that a particular change caused the outcome.
Discuss a project like this04 / 04 · SUPPLIED DASHBOARD90-day dashboard selection
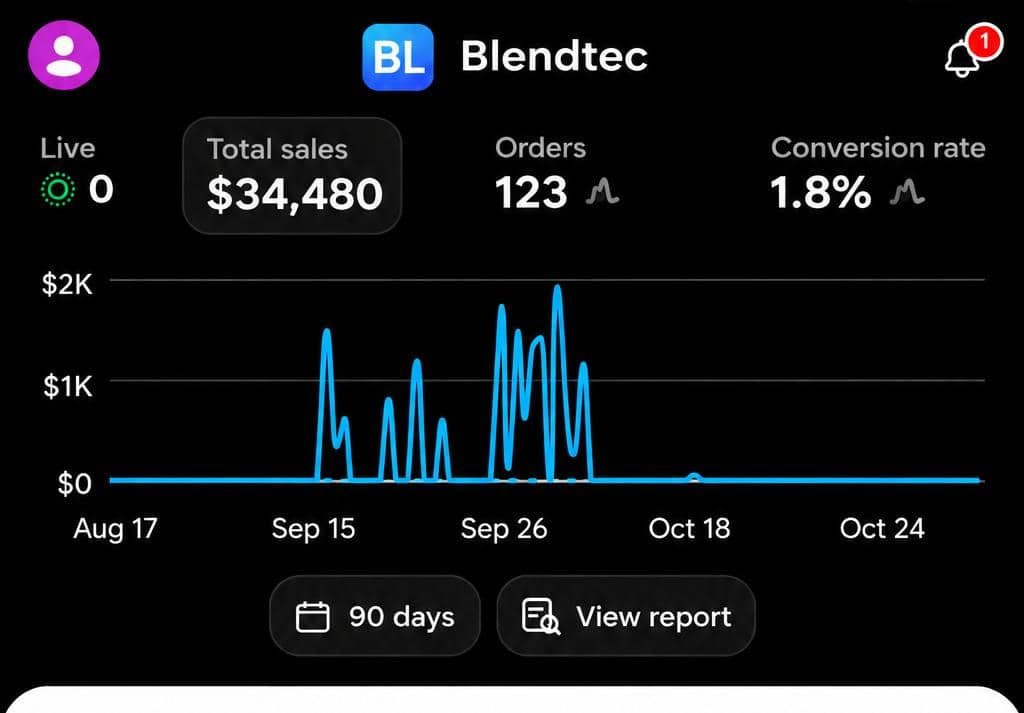
Blendtec: reading the dashboard snapshot.
The dashboard screenshot displays $34,480 in total sales, 123 orders, and a 1.8% conversion rate, with a 90-day range selected. The snapshot should be considered alongside the store’s baseline, traffic sources, campaign activity, and actual scope of work.
Total sales$34,480
Orders123
Conversion rate1.8%
Figures are transcribed from the supplied screenshot. They are not a guarantee of future performance or proof that a particular change caused the outcome.
Discuss a project like thisYour store, your goals
Let’s identify the numbers that matter for your store.
Tell us where your store is today and what you want to improve. We’ll discuss the context, priorities, and project scope before work begins.